The 2018 Tour de France isn’t just a display of athletic prowess and endurance; it’s also a platform for showcasing some of the latest innovations in Big Data, the Internet of Things (IoT) and machine learning. ITU recently caught up with Peter Gray, Senior Director – Technology at Dimension Data Sports Practice, an IT services firm, about how advancements in technology are affecting this year’s race.
How is Dimension Data promoting technological innovation at the Tour de France?
In business, success boils down to delighting your customers. And who are the customers during the Tour de France? The fans. That’s why technological innovation at the Tour de France is all about improving the viewer experience.
‘Since 2015, we’ve introduced sophisticated IoT-connected technology, machine-learning algorithms and predictive analytics.’ – Peter Gray, Senior Director – Technology, Dimension Data
Last year, we brought machine learning and predictive analytics to the race, enabling us to tell compelling stories every second of the Tour, such as when the peloton will catch the breakaway group, the average rider speed during a crash and the changes in pace as sprinters dash for the finish line.
These stories are told via data visualisations, available across broadcast, digital and social.
Why is the Tour de France a good platform for spotlighting innovation?
The Tour is the biggest race in the world: attracting 12 million TV viewers per stage from across 190 countries, 6.5 million digital fans and 3 million followers of the Tour’s official Twitter account. The 2017 Tour saw online race videos consumed 71 million times, and it’s estimated 10-12 million people will line the roads of France.
What sets us apart from the rest of the Tour’s sponsors is that our partnership is exactly that, a long-standing relationship with the race’s organisers (the A.S.O.) that’s built on trust, interdependence and mutual commercial benefit. This isn’t merely a badging exercise for us; we’re providing real value for everyone involved.
How has tech changed in this Tour de France compared to previous years?
Dimension Data first teamed up with the A.S.O. as the Tour’s official technology partner in 2015, and prior to this, data collection was a very manual and time-consuming process, usually communicated by radio.
It meant many of the more intricate and compelling stories at the Tour went untold, as the cameras tend to focus on the front of the pack.
‘By combining the digital assets with television coverage, the partnership has reinvented the traditional broadcast model.’
Since 2015, we’ve introduced sophisticated IoT-connected technology, machine-learning algorithms and predictive analytics, which enable us to track every single rider across every second of every race – meaning viewers can monitor their favourite cyclist or team, regardless of their race position.
How do you collect, analyse and distribute data from tracking devices?
Each of the 176 riders have their bicycle fitted with a simple device that captures a GPS positioning point every second of every stage. This means by the end of this year’s Tour de France, over 135 million data points will have been captured.
The location data is relayed alongside live TV images and immediately analysed by experts – who use it to calculate real-time insight such as rider speed, relative distance and group composition.
Merging this with third-party data allows for even more granular analysis to reflect on gradient and elevation gain, weather impact and visually enhanced 3D mapping.
RELATED: 4 emerging technologies on display at the 2018 World Cup
By combining the digital assets with television coverage, the partnership has reinvented the traditional broadcast model. Those watching on television will enjoy dozens of data visualisations detailing rider, team and peloton speed, each cyclist’s position, and the likely rate of catch.
From a digital perspective, fans can track their favourite cyclist or team in real time. Dimension Data’s official Tour de France Twitter account (@LeTourData) presents followers with a wealth of data visualisations, from straightforward information such a rider speed and position, to predictions on whether the pack will catch the break.
What are the benefits of machine-learning algorithms in these efforts?
By combining the live-tracking and historical data from past Tours with our machine-learning algorithms and predictive analytics, we’re able to make accurate predictions about the outcomes of various stages. For example, last year, our #ddpredictor correctly called the top-placed riders 71.4% of the time.
‘We can weave together complicated data sets to tell compelling stories.’
By combining the basic information we have with variables such as rider speed and position, wind speed and strength, weather conditions and gradient, we can weave together complicated data sets to tell compelling stories.
All this information is hosted on a real-time, Big Data analytics platform (powered by Dimension Data’s cloud) that sucks in all those data points, cleanses, enriches and enhances the data, and then ultimately produces a shiny set of insights that is used to tell captivating stories.
How do you protect data from cyberattack?
We’re a global leader in cybersecurity, so not being able to practice what we preach would be unimaginable. At the beginning our Tour de France partnership, we used a closed environment for the deployment, but over the past three years we’ve steadily transformed from managing an on-premise solution to running everything in the cloud.
RELATED: KT showcases 5G innovation at the Olympics in PyeongChang
This year will be the first time we have an entirely cloud-based security environment, with numerous layers of security being integrated with real-time predictive capabilities (another first for 2018). This will enable us to identify and respond to potential threats in a way we’ve never been able to do before – and a lot more quickly.
Our managed security services capabilities give us a platform for managing operations swiftly and effectively, helping us achieve that balance between security and business agility.
What tech innovations would you like to see in future races?
It’s genuinely exciting how many possibilities there are for tech innovation at future Tours – and this is something we’ve started nurturing within our own four walls.
This year saw the launch of our ‘Le Code to France’ competition, an internal initiative aimed at engaging Dimension Data’s 30,000 global employees, driving innovative ideas that can be implemented during future Tours.
Standout ideas included a 3D virtual reality rendering of a Tour stage you can watch on your coffee table, a fantasy predictor game based off machine learning algorithms, and a sophisticated chatbot that could answer live questions about what’s happening during the race.
We’re going to be testing these over the next year or so, with the ultimate aim of introducing them at future Tours – watch this space!
Views expressed in this article do not necessarily reflect those of ITU.
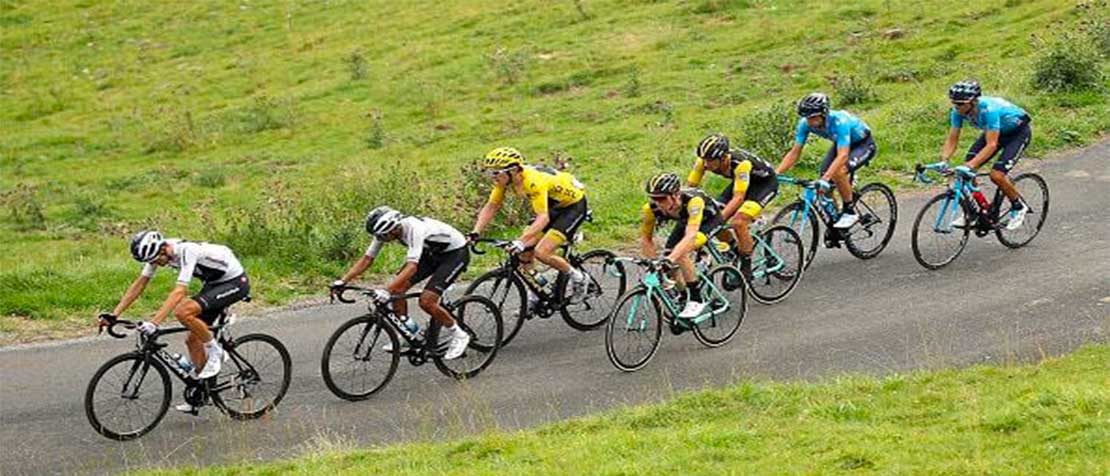
Photo by Chris Graythen/Getty Images
 Peter Gray is Senior Director – Technology at Dimension Data Sports Practice.