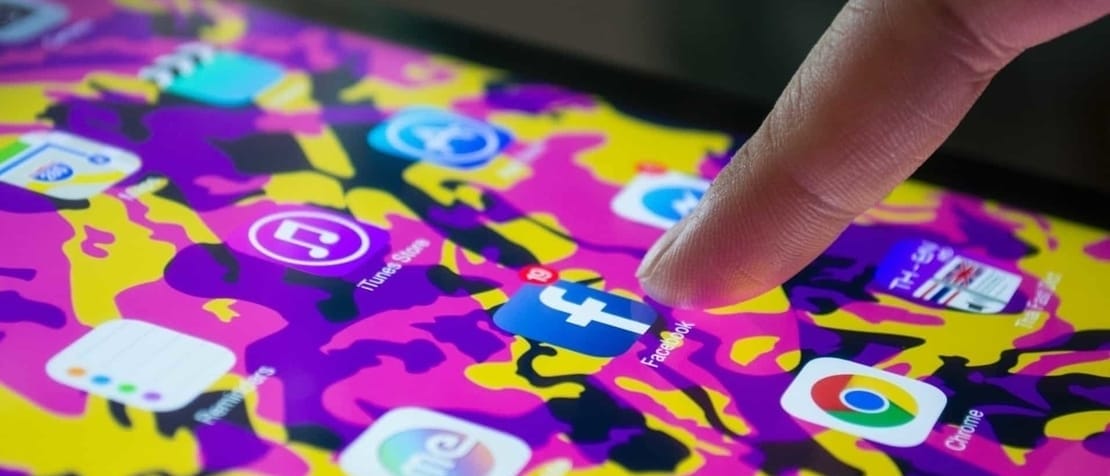
Online advertising is often viewed as a kind of “necessary evil” to pay for free services such as Google and Facebook; the Faustian bargain at the heart of the “if you’re not paying for the product, you are the product” wisdom.
To my colleagues and me, it is also a useful data source to build models to track internet usage gender gaps, and to monitor international migration, map poverty and more.
We believe that, when used responsibly with awareness of the limitations and risks, data from advertising platforms are an important part of the AI for Good ecosystem, helping to augment official statistics and supporting the monitoring of the United Nations Sustainable Development Goals.
Let me explain how.
Platforms such as Facebook, Google, Snapchat and others collect data about their users and use this data to provide targeted advertising capabilities. For example, on Facebook it is possible to selectively show an advertisement to users aged 18 and above who: a) live in Geneva, Switzerland; b) self-identify as female; and c) used to live in France.
Similar targeting capabilities exist on other platforms. As it matters for budgeting purposes, advertising platforms provide so-called “audience estimates”. For instance, in the example above, Facebook estimates that 5,900 users match the provided criteria (as of 23 March 2019).
By looking at how these audience estimates differ across gender and across countries, one can obtain real-time estimates of usage differences of big social networks. In our research we find that these gender differences are highly predictive of internet access and mobile phone gender gaps. Building regression models on top of these audience estimates allows us to fill data gender gaps. As an example, applying such a model, we predict that for every man with internet access in India, only 0.73 women have internet access. Visit the website for a visualization of these predictions.
These predictions are useful for monitoring progress on the Sustainable Development Goals, in this case on SDG 5. Additionally they can be used for planning and monitoring development interventions at the sub-national and even at the sub-city level.
READ MORE: How digital technologies can speed up gender equality
Similarly, by looking at how the number of Facebook users who used to live in a different country varies across host countries and regions, one can obtain models that, when properly corrected for biases, come close to gold standard official statistics.
Such non-traditional migration statistics are of particular value when official data are outdated or of sub-optimal quality. For example, during the ongoing Venezuelan crisis and the related exodus of migrants and refugees, we are providing the Global Protection Cluster with insights on the relative spatial distribution, or “density”, and the temporal trends. Triangulating these insights with other data sources can lead to better resource allocation in the field and more informed discussion with donors on the scale of the crisis. See more details of our analysis here.
In addition to shedding light on digital gender gaps, audience estimates can also help to map relative levels of poverty and wealth. In a nutshell, having access to Apple mobile devices running iOS, as opposed to Android devices, is a sign for higher disposable income.
To illustrate this, we invite the reader to interact with the data visualization of Demographic Distribution in New York City. It shows aggregate and anonymous Facebook audience estimates collected in September 2017: 83% of users living in the New York City ZIP code 10075 primarily use an iOS device.
This is in stark contrast to ZIP code 11368 where this percentage is only 42%. These two ZIP codes, which are at the extreme ends of iOS usage in New York City, are also at the extreme ends of poverty rates. 10075 is located in the Upper East Side which has a poverty rate of 7%, as opposed to 11368 located in Elmhurst and Corona with a 27% poverty rate.
In our research, we find that this approach to map relative poverty rates by looking at the device types used to access Facebook also works in other countries.
RELATED: What do ‘AI for Social Good’ projects need? Here are 7 key components.
All of the insights above can be obtained from anonymous and aggregate data that is provided free of charge and are available to everyone who registers as advertiser. Despite the availability and ease of use, there are important limitations when using such data.
- All platforms include fake accounts and different users can share a single account, leading to data quality challenges.
- Usage patterns and the platforms’ black box algorithms for inferring attributes change over time, potentially breaking the applicability of prediction models trained on past data.
- People without a digital footprint on the platforms do not directly contribute to the data, requiring care for how to incorporate data on non-usage and service penetration in the models.
If we can figure out how to navigate these challenges and how to limit the risk of abuse of such a powerful data source, then we could start to realize the tremendous potential of using this data for good.


